Showing posts with label metrics. Show all posts

Monday, 5 October 2020

How to measure the waste in the KM supply chain

If KM is a lean supply chain for knowledge, how can you measure the amount of waste in the chain?


Shredded waste, image from wikimedia commons
I have often used the concept of a knowledge supply chain as a way of describing Knowledge Management; the supply chain being a mechanism for providing knowledge to the knowledge worker in an efficient and effective way, just as a materials supply chain provides materials to the manual worker. 

If you go one step further, you can use the principles of the lean supply chain, as applied to materials supply, to make the knowledge supply chain even more efficient. We do that by eliminating "the 7 wastes" of overproduction, waiting, unnecessary transport, non-value-add processing, unnecessary motion, excess inventory, and defects. 

But how can we measure the current level of waste in the knowledge supply chain? Here's how.

  • Waste #1. Over-production—producing more knowledge than we need.
We might measure this by measuring how much of what is published is actually useful. We could for example look at the read-rates of content (how much content never gets read), or the duplication of content. For example the World Bank commissioned a study of "Which World Bank Reports Are Widely Read", which was able to analyse which of the reports were widely downloaded and cited, and which remained unread, and therefore represent over-production.  A lot of effort and knowledge goes into these reports, and the last thing the World Bank wants is to create reports which are never downloaded.  We could also look at the push/pull ratio in communities of practice, balancing the number of question-led discussions against the number of publication-based discussions (see this analysis of linked-in discussions, for example). 


  • Waste #2. Waiting. 
Here we measure the clock-speed of knowledge, such as the time it takes for a community question to be answered, the time it takes to find relevant synthesised knowledge, or the time it takes for lessons to be a) collected and b) embedded into guidance.


  • Waste # 3. Unnecessary transport of materials. 
 In our knowledge management world, this really refers to hand-off, and we might measure the number of links or steps between knowledge supplier and user. Communities of practice, for example, where "ask the audience"-type questions can be asked, and answered directly by the knowledge holder, will minimise the number of handoffs. With a large community of practice, everyone is at One Degree of Separation.  A wiki, where knowledge suppliers can update knowledge themselves without going through unnecessary editorial process, can also minimised handoffs.

  • Waste # 4. Non-value added processing—doing more work than is necessary. 
We might measure this by looking at the degree of processing the end user has to do to get an answer to their question, and how much synthesising is done by the user, which could be done further up the supply chain.  For example, does a user have to read and understand all lessons in a database on a particular topic, or can you make sure that these have already been synthesised into guidance?


  • Waste # 5. Unnecessary motion. 
We measure this by counting the number of places the knowledge user needs to go to in order to find relevant knowledge. Do they have to visit every project file to find lessons, or are the lessons collected in one place? Is there one community of practice to go to, or many? Linked-in, for example,  had at one time 422 discussion groups covering the topic of Knowledge Management rather than only one. That is a waste of 421 groups (99.8% waste).


  • Waste # 6. Excess inventory
Like waste 1, we look at the unnecessary, duplicate or unread knowledge in the knowledge bases and lessons learned systems.


  • Waste # 7. Defects
Here we measure now much knowledge is out of date, and how much is poor quality. Some organisations, for example, measure the quality of lessons with a lesson management system, and often find that much of the content is of very poor quality. If your users are telling you that the lesson management is full of poor quality lessons, then you have a defect problem.

All of these metrics are indicators that your KM framework, or knowledge supply chain, is far from efficient. 

Tuesday, 29 September 2020

How do you know KM is failing?

How do you know KM is failing in your organisation? This was a question raised yesterday at a workshop I ran a few years back at KM World.


Assuming you have introduced KM, embedded it into business processes, and the central KM team has effectively handed it over to the business, how can you tell whether this was successful, and that KM is alive and well?

This is an issue we faced in one organisation about 10 years ago, and the clue that KM was failing came through a series of metrics.

  • Attendance at KM training courses was dropping
  • The rate at which lessons were entering the lessons database was falling
  • Activity in the community of practice was decreasing 
  • At the same time, there was a change in the business metrics, and costs began to rise.

Of course it may have been coincidence that costs were rising at the same time as KM activity was falling, but all of these metrics gave us concern that KM was beginning to fail, and may have been having an adverse effect on business efficiency.  We therefore introduced a KM refresh program, aimed at the middle managers in order to engage them in clarifying and reinforcing the KM expectations.  Things picked up again, and the business metrics began to improve.

The way you can know KM is failing is through metrics. 

  • Activity metrics can show the drop-off of KM activity, 
  • Compliance measures can show that people are no longer doing whats expected of them in KM, and
  • Business metrics can show any associated business impact. 

Make sure you have a "KM dashboard" so you can track activity and spot the warning signs in time to take evasive action.

See our winter 2009 newsletter for more on metrics.

Thursday, 3 September 2020

The value in KM comes from reducing the Frequency and Cost of Lost Knowledge. Here's how.

One the  enduring challenges in Knowledge Management is defining effective metrics to measure its value. A promising metric which may fill the gap is the Frequency of Lost Knowledge (FOLK) and it's partner the Cost of Lost Knowledge (COLK). 

Image from wikimedia commons

In safety management, they talk about "lost time incidents" (LTI), where through the failure of the safety management system, somebody sustains an injury which causes them to lose time at work, either through treatment or through convalescence. A core safety metric is the LTIFR, or Lost Time Incident Frequency Rate.

In knowledge management, we could talk about "lost knowledge incidents" (LKIs). This is where critical knowledge is or was once available to the organisation, but failed to reach the person who needed to act upon it, with negative consequences. These consequences may be seen as a mstake, a failure, an added cost, or a missed opportunity.

 Unfortunately a lost knowledge incident is far less visible than a lost time incident. An LTI is visible because a person is not available for work, while a LKI is only visible when a mistake is repeated or a capability lost. Probably the majority of LKIs go undetected, although it is possible to identify knowledge loss "Near misses".

You can begin to measure Frequency of Lost Knowledge (FOLK) through surveys or through careful analysis of the lessons management system. A company I was working with recently ran a survey where one of the questions asked was "do you know of any examples where projects made mistakes or failed because lessons were ignored or missed". 75% of staff answered yes. In a more recent survey, this had fallen to 26% - still too high, but a massive improvement.

FOLK is one parameter, the other is the cost of the lost knowledge (COLK). In some cases this can be huge.  Here is a very good example, where the loss of knowledge about making nuclear weapons cost £69 million to replace.   If you can look at a selection of lost knowledge episodes and calculate the cost of these to give an average cost, then multiply this average cost by the estimated Lost Knowledge Incident Frequency Rate, then you end up with a total estimated COLK.

Again you can use surveys, or analyse the lessons management system, to arrive at this estimate. In one survey, we supplemented the question "do you know of any examples where projects made mistakes or failed because lessons were ignored or missed" with two more questions - "what was impacted by this mistake/failure? (cost, time, safety, reputation)", and "please estimate the size of the impact".

Another organisation looked at the cost of rework in manufacturing, and attributed the rework to a number of factors, one of which was knowledge. This enabled them to estimate both FOLK and COLK.

Knowledge management will reduce the incidence and cost of Lost Knowledge. Please note the Cost of Lost Knowledge is a finite number, and the value KM delivers will approach, but not exceed, this number. The more you spend on KM, the closer to get to eliminating There will be an optimal spend on KM by calculating the required ROI vs the COLK.


What causes a Lost Knowledge incident?

  • It can happen when somebody had knowledge, but doesn't want to pass it on or record it. This is a cultural failure.
  • It can happen when somebody had knowledge, but had no mechanism to pass it on or record it. This is a failure of the KM framework (and by Knowledge Management framework, I mean the combination of people, process, technology and governance).
  • It can happen when somebody had knowledge and had passed it on, but that knowledge can no longer be found. This is also a failure of the framework.
  • It can happen when somebody needs knowledge, and has the mechanism to find it, but doesn't know that they ought to look or ask. This I would suggest is also a failure of the framework, because there should be processes for knowledge seeking built into activity.
  • It can happen when somebody needs knowledge, and has the mechanism to find it, but they don't want to look for it or don't want to consider it. This is a cultural failure, often known as "not invented here".

What if somebody needs knowledge, has the mechanism to find it, looks for it, finds it, considers it, and then decides after mature consideration that it's not applicable for their situation? I would say that this is not a failure of the knowledge management system, and there must be many many cases when this is the right thing to do. The key here is the mature consideration - if you just ignore the lesson because you naively think "this time our project is different" (the most dangerous words in project management) then this is not mature consideration, its another cultural failure. 

Tracking LKIs and estimating FOLK and COLK will not be an easy task.  The survey approach described above is one way to do it ( a top-down analysis), while an analysis of project failures, cross-referenced to the lessons management system is another, bottom up, approach (the approach taken by the organisation analysing rework costs).

Both ways may give you a useful order of magnitude estimate for FOLK and COLK, which should both decrease over time as your KM system develops.

Wednesday, 15 January 2020

How to choose KPIs for a KM team

How do you measure the performance of your Knowledge Management team? What sort of KPIs should you choose?


Image from wikipedia
The answer to this question depends on the stage that KM implementation has reached. I suggest some KPIs below, for each of the different stages of KM implementation.

During the early strategy and planning phase

KPIs are difficult during the strategy and planning phase, as the KM team have not yet delivered anything - they are still planning. At this stage there is probably only one objective; "Deliver a well-researched Knowledge Management strategy and implementation plan that has the support of the key business stakeholders". This will be easier to accomplish if your key business stakeholders are acting as a steering team for the KM program. The KPI will be the level of support for the strategy.

During the piloting phase

 Part of the purpose of the Knowledge Management pilots is to deliver tangible business value through operation of KM within the pilot areas, with a secondary purpose of refining the Knowledge Management Framework prior to roll-out. The primary objective during the piloting stage is therefore the amount of value delivered through pilots, and the target value should be determined through discussion with your steering team, and should be set at a level where, if you deliver this value, the steering team will commit to the next phase. 

This was the primary KPI for the BP KM team during piloting in 1998, when we were charged with delivering $100m of value to the organisation through KM pilots. 

The secondary KPI for the KM team at this stage should be the number of elements of the Knowledge Management Framework which have been tested in action within the business, with improvements made as required. The target should be 100%.

During KM roll-out and transformation

During the roll-out phase, purpose of the KM team is to spread the KM transformation across the entire organisation, while continuing to add business value. The team therefore has three primary KPIs,

  • The percentage of the organisation which has reached a defined KM level, 
  • Activity metrics such as number and value of lessons, maturity of CoPs, and
  • The value added by KM to the business.
You can also add activity metrics such as the number of training courses run, the number of communities launched and so on.

During KM operation

After the roll-out and transformation phase, Knowledge Management becomes part of normal business, defined by a set of expectations within a Knowledge Management policy. At this stage, the role of the KM team is to support the business in compliance with the policy, and hence deliver value to the business.  Suitable KPIs for the KM team would be the following;
  • The level of business compliance with the expectations in the KM policy
  • Support activity metrics (such as training courses run, KM role-holders coached etc)
  • Activity metrics such as number and value of lessons, percentage of embedded lessons, completeness currency of knowledge bases,  maturity of CoPs, etc
  • The value added by KM to the business

Wednesday, 11 December 2019

7 ways to speed up your KM

Just doing KM well is not enough, you have to do KM at the required speed. 


Public domain image from Pixnio
The world is changing, and organisations need to learn faster than the speed of change if they are to survive. According to Erick Thompson, assistant VP for knowledge exchange, the St Paul companies, "KM initiatives should also focus on the speed factor. Companies have to learn how to learn faster" (quote taken from Mahadmohan Rao's book ""Leading with Knowledge"). 

The world is increasingly a competitive learning field. In the past, when progress was slower and the rate of change was lower, an organisation could compete on its products, its patents, its reputation and on its people. However the rate of change is increasing, and companies need to adapt.  Markets are changing, customers are changing, expectations are changing, regulations are changing, the world is changing, and it is changing faster and faster. If companies are to adapt, they need to unlearn old habits and learn new ones. And in a competitive world, the fastest learner wins.

The British Army takes a similar view: you have to try to get inside the enemy's OODA (observe, orientate, decide, act) loop. If you generate and use knowledge at a faster tempo than your competitor (a faster rate of learning than the enemy), you will win.

So how do you increase the speed of your internal Knowledge Management cycle? Here are 7 ways.


1. Set targets
How long should it take to be able to find basic knowledge on your Intranet? How long should it take to receive an answer from a CoP? How long should it take before a new lesson is embedded into business process? Set some aggressive targets, like the senior manager at McKinsey who declared that all CoP questions should find an answer within a day, or the "three ones" target set by a Chinese knowledge manager ("a search for job-related knowledge should be successful within 1 minute, a question to a CoP should be answered within one day, and lessons from a closed project should be available to the organisation within one month").

2. Build your Communities of Practice
Any knowledge that is less mature, more complex or more context-dependent may not be documented. Ensure you create the networks of people through which this knowledge can be transferred. Focus the CoP on problem solving and on answering questions if you want it to perform rapidly. Focus on Pull, not Push. Ensure the community facilitator helps ensure questions are answered promptly.

3. Build the knowledge bases that cover routine activity
Any knowledge that is sufficiently mature, simple, and context-independent should be documented online in an easily findable location. All of your process documentation, manuals, training material should be put onto a wiki or similar knowledge base so people have it at their fingertips.

4. Ensure active lessons management
In a previous blog post I described two lessons learned systems - one which takes 2 years to make changes based on new lessons, and one which takes a couple of weeks. The second system is obviously far more efficient. You cannot afford to wait years for lessons to be embedded. Each unembedded lesson is a lesson currently unlearned, and an unlearned lesson carries the risk of reinvented wheels and repeat mistakes. Ensure you have an effective Lessons Management system, with a person or team in charge of making sure it is working well and quickly.

5. Update your knowledge bases as soon as new knowledge becomes available
There is no point in updating the knowledge bases annually, if the organisation needs to learn more rapidly. Lessons from the lesson management system, or answered questions from the CoPs, or results of trials and prototypes, should find their way into the knowledge base as quickly as possible. I was with a client last month, and they were feeding lessons into standards documents which they could only update annually, but they could at least collect new knowledge in a "pending updates" annex to the standard.

6. Measure against the targets you set.
Collect, and report, "speed of learning" metrics. Your dashboard should include online search time, the time to reply to CoP questions, and the time it takes to a) document and b) embed lessons. These are measures of your learning clock-speed. Seek to keep these times as low as possible, and continuously decreasing.

7. Fix any problems you see.
The measures that you collect will show you where there are delays and bottlenecks in your KM framework or workflow. Make sure you act on these to remove the bottlenecks.

Once the KM framework is in place, use these 7 methods to optimise your learning speed.

Effective learning is good, speedy and effective learning is even better.


Monday, 25 November 2019

The benefits and limitations of KM change and maturity models

This is a reprise and rewrite of a post from 5 years ago about KM change models vs KM maturity models. AKA "why KM change is more like spread of a forest fire than the growth of a tree".


Photo from the US National Parks Service
The use of a maturity model allows an organization to have its methods and processes assessed according to management best practice, against a clear set of external benchmarks. Maturity is indicated by the award of a particular "Maturity Level". The majority of KM maturity models (and ours is no exception) have a series of descriptors of various levels of KM maturity, and the implication is than an organisation can progress from one level to the next in a smooth maturation process.

The analogy, if you like, is that of a tree. As a tree matures, it passes from a seedling to a sapling to a mature tree, but this is a continuous progression. You can describe, using metrics such as the number of branches, size of trunk, number of fruit, where the tree is on its maturation journey. If you won an orchard, you can describe the average maturation level of the trees as (for example) 2.5 on the maturation scale.

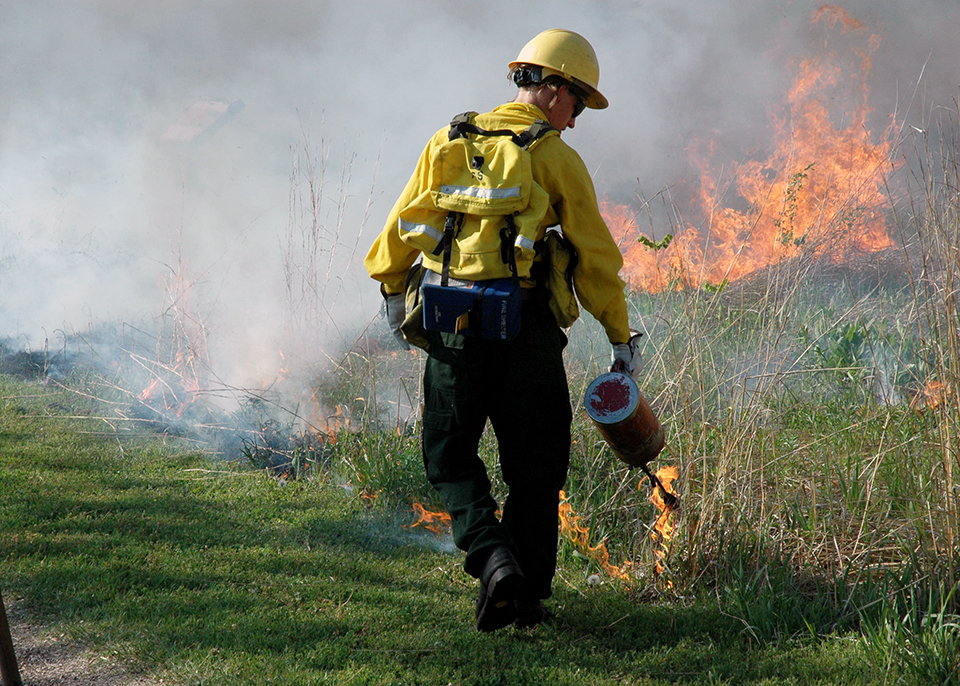
Knowledge Management is more like a forest fire than a tree.


A forest fire does not mature slowly. It catches in one small place, then sweeps across the landscape.  In a forest fire, change is not top-down nor bottom-up, but side to side (see my blog post http://www.nickmilton.com/2019/07/km-change-is-not-top-down-or-bottom-up.html for more detyails. A forest fire is not a maturation process, it is a phase-change, from unlit to lit. There are various measures of readiness for forest fires - they can be enabled by hot weather, strong winds and a build-up of combustible material, or disables by fire-breaks and rain - but it still is not a process of maturation.

I am aware as I write this that a forest fire is also a highly dangerous life- and property-threatening phenomenon and a lethal consequence of global warming. If you find this metaphor too negative, please use another, such as kindling a bonfire, or adoption of a virally-marketed product.

Knowledge Management is a forest fire rather than a tree, because implementing KM is a culture change process. It involves changing hearts and minds, and hearts and minds are changed one at a time. We have all seen the moment when a heart/mind changes and someone "gets lit". It's that lightbulb moment, like "catching fire". There is no maturation for a process, only the question "has it caught fire". Once it has, the question becomes "how much is burning".

I describe here a change model for hearts and minds which you can apply to your key stakeholders, that takes them up to a commitment threshold, beyond which KM can be adopted. Below this threshold they are unlit kindling. Above this threshold they are alight.

KM then works only if all the conditions are sufficiently right to change the hearts and minds. Once the conditions are right, you light the KM fire in a small part of the organisation (a KM pilot), and once this is burning, adjacent areas will also catch fire, until finally the whole area has caught the KM habit.

That's the change model - what's the problem with maturity models?


Maturity models are popular, and give the organisation a chance to compare themselves against a standard, and to identify room for improvement. This can be a useful check, but maturity models have a number of drawbacks (for a deeper discussion, see chapter 27 in the new edition of the Knowledge Manager's Handbook).


  • The first is that the model may have gaps or be based on inaccurate assumptions. There are many maturity models, for example, which ignore the issue of governance, and others that include content as a key component (thereby assuming that Knowledge Management is basically Content Management). Choose your model wisely, or (better) use more than one.
  • Most maturity models make assumptions about the sequence in which things have to happen, and these assumptions do not hold true universally. 
  • I large and complex organizations, where the organizational landscape is heterogeneous, a maturity model tends to gloss over or average out significant differences in portions of the landscape, removing them from visibility and opportunity for action. The maturity model may say "the forest is cool" when in fact the fire is already blazing somewhere local.
  • Finally, as discussed above, KM implementation is not one of gradual maturation across the organization at large, but of spreading the adoption of a new paradigm, and thus the idea that the organisation matures in a stepwise process is inappropriate.


Take Leadership, for example.

Senior management support is the biggest enabler (and lack of senior management support is the biggest barrier) to KM. Leadership is vital. Imagine a leadership scale from 0 to 4. Imagine you have moved leadership from level 1 to level 2. Is this progress?  If level 4 is "whole--hearted support from senior management", what is level 2? Half-hearted support? That's as bad as no support at all. Until you get to level 4, you don't have what you need for sustained KM.

Rather then trying to move the whole organisation to level 2, why not find the one leader who you can help reach level 4? Leave  the rest at level 1 for the moment, and find the early adopter. Gain their whole-hearted support to pilot Knowledge Management in their part of the business, deliver success, and use this to change the next Heart and the next Mind.

The indicator of progress is therefore not the average level of KM leadership maturity, but the presence or absence of the "first sponsor" in the organisation.


What is the conclusion regarding maturity models?


For all these reasons, maturity models are much better used:

(a) not for assessment and objective benchmarking, but as part of an internally driven diagnostic and planning mechanism along with a lot of independently gathered data, where the question is not “how mature are we against external assumptions?” but “what can this external model suggest to us about our strengths and weaknesses, and which of these areas should we prioritise based on known needs?”; or  
(b) in homogeneous, well defined contexts such as communities of practice, knowledge-base development, or expertise transfer, where there are specific, well-known good practices and reliable precursors that hold true in most cases.

In Knoco, we actually do offer a maturity model, which we offer as a free online survey (choose Maturity Survey in the box at the top of the page). It is of some use, but treat it with caution for all the reasons mentioned above.

In addition we suggest you measure a number of other things;
The real message behind all of this is that KM is a change program, and needs to be measured using change models.

KM does not mature like a tree; it catches hold like a flame, and that is how it should be measured.


Friday, 15 November 2019

How to identify a knowledge "near miss"

In organisational safety management, they identify a "near miss" as evidence that safety practices need to be improved.  We can do the same in knowledge management.


Image from safety.af.mil
I have often used Safety Management as a useful analogue for KM, and here's another good crossover idea.

In safety management they identify safety breaches (accidents, injuries, "lost time incidents") as metrics and indicators that safety management needs to be improved.

They also track "near misses" - incidents where nobody was harmed, but only by luck, or "unplanned events that did not result in injury, illness or damage – but had the potential to do so". A hammer dropped from height and landing a few feet away from a worker on the ground, a bolt blown past someone's head by an escape of compressed gas, a near collision between two aircraft, all are examples of near misses indicating that safety management needs to be improved. 

In KM we can  track lost knowledge incidents, where time, money or effort was wasted because knowledge should have been available but "got lost" along the way. The knowledge is or was once available to the organisation, but failed to reach the person who needed to act upon it, with resulting cost to the organisation in terms of recovery cost, rework, lost sales, delay etc. If you are lucky you can quantify this cost as part of the Cost of Lost Knowledge, aka the Cost of Ignorance, and use this in your KM business case.

But we can also track Knowledge Near Misses. This is where the knowledge was not lost and no cost therefore incurred, but it was only found or transferred by lucky chance.

I heard a great example recently in a client organisation (and I paraphrase below).

The organisation was planning an activity. It seemed a little risky but quite doable, and there was management pressure to go ahead. They were discussing this activity in a meeting, and someone from another part of the business who happened to be in the meeting by chance (he was not invited to discuss this particular activity) spoke up and said "I was part of a team that tried this before. It was a complete disaster, and we are still recovering from the mess it created".

The lessons from this previous project had not been captured, they were not in the lessons database, and the project report was not findable but buried in a mass of project files on a hard drive somewhere. Had that person not by chance been at the meeting, the "complete disaster" would most likely have been repeated with resulting costs in manpower, money and reputation.

This was a knowledge near miss. This event did not result in cost to the organisation through lost knowledge, but had the potential to do so, and was only avoided through luck. With a proper KM framework in place, and followed by all staff in a systematic way, this knowledge would not have been lost, and the planned activity could have been assessed in the full light of historic lessons.

You can find another KM near miss story here

The knowledge near miss is a useful metric which provides evidence of the value of, and need for, effective KM.


Tuesday, 6 August 2019

The only metric that counts in KM

A recent article by Steve Denning throws light on the only KM metric that counts;  Impact.


Image from wikimedia commons
The article in Forbes, entitled "Why Agile Often Fails: No Agreed Metrics", discusses the metrics systems used at Amazon, and compares them with those used when Denning was CKO at the World Bank. Denning makes the point that these metrics seldom make a difference.

"Someone asked the fateful question, that still haunts me: had any of us ever experienced a significant change in our organization’s behavior as a result of those metrics? We went around the room and the answers were unanimous: none of our organizations had ever changed their behavior significantly as a result of the wonderful sets of metrics that we had developed".

He identified 4 types of metric commonly applied to change programs such as Agile and Knowledge Management; as follows:

A good idea”: an activity that is undertaken because enough influential people believe that it is likely to have some benefits. These are often, as Scrum.org points out, “really just conjectures about what customers might like (sometimes referred to as HiPPOs, or Highly Paid Person’s Opinions) ... The specification of the solution is vague and imprecise…” At worst, they are the hobby horse of some organizational faction promoting their own particular interest. 
An output”: something internal, measurable but not necessarily related to any external customer. This is better than a mere conjecture that it is a good idea, but still not getting the organization very far in terms of understanding the activity's value. 
“An outcome”: something external such customer satisfaction in relation to value delivered. It is often subjective and vague and fuzzy. The Net Promoter Score, which fits into this category, has been shown to be positively correlated with actual impact and is certainly better than not having any measure, but its meaning can be ambiguous and difficult to read. 
“The impact”: changes in customer behavior that the product or service is intended to elicit. This goes beyond merely whether the customer buys the product or service and may include measures of actions—or non-actions—that you would expect if the customer is truly delighted, such as timely availability of the item, speed of delivery, percentage of unexpected “hiccoughs” in delivery, absence of returns and complaints, re-purchases of the product and related products, responses to surveys recommendation of the products to other customers, and so on.

The forthcoming Knowledge Manager's handbook, also identifies 4 types of metric:

There are four main types of KM metrics, and each has a specific purpose. It is important not to confuse them, for reasons we explain below (in the book). Together they form an integrated system of measurement for ongoing administration, learning and governance. The four types are: activity metrics, performance (or compliance) metrics, maturity metrics and impact metrics.

Like Steve, we believe Impact metrics are the only ones that  really count and that really make a difference, whether that is Impact to the customer, or Impact to the work of the organisation. As we say in the book:

The purpose of impact metrics is to enable senior management to assess the continuing contribution of KM to the business, and they should link back to the intended benefits and outcomes of KM outlined in your KM policy. .... Impact metrics can be “hard” in terms of quantifiable benefits to the business (e.g. reduced costs, improved sales, improved quality), in which case they will be derived from specific examples continuously gathered from your KM activity streams. Impact metrics may also be “soft” in the form of evaluations from managers in the different lines of business as to the added value that KM brings to the way that work is conducted. “Soft” evaluation metrics like this can be gathered through surveys, interviews or focus groups. These mechanisms, if conducted periodically, are also useful ways to identify opportunities to streamline, enhance or fine-tune the KM processes or the support that is offered by the KM operational team.
Steve contrasts the way he used metrics in the World Bank with the way metricas are used at Amazon.
Amazon’s metrics operate at the fourth level and aim to measure impact. Organizations that don’t have these kinds of metrics and the associated behavioral norms in place to support them are flying blind. It shouldn’t come as a surprise that they frequently crash. Why don’t intelligent organizations measure impact? One reason is that thinking through impact in advance isn’t easy ... but it's one of the rules of the road at Amazon. In fact, work on an activity or capability can’t start unless and until the team has figured out how it will measure customers' response. Amazon builds in customer metrics as a “forcing function” from the outset. Teams may spend weeks just thinking through the metrics.

Steve believes, Amazon believes, and we also believe that Impact metrics are the only ones that count, and should be set in advance, and used to measure and drive and tune your KM implementation efforts. This is not easy, and you may need to "spend weeks just thinking through the metrics", but anything else is "flying blind". With impact metrics, you can set targets and measure whether those targets are met. You can change your direction based on whether those targets are met or not. You can use them to steer your program, and you can use them to measure the value contribution KM brings.

Remember, if KM is not making an impact, then its not worth doing. So make sure you measure and report that impact.

Monday, 13 August 2018

7 Metrics for the KM supply chain

The Supply Chain analogy for KM suggests several metrics we can use.


I have often used the analogy of the supply chain as one way of thinking about KM. This involves looking at KM as a chain of processes supplying knowledge to the user.

This analogy has the benefit of thinking about KM from the point of view of the knowledge user. You can ask "If a person in this organisation were in need of a specific piece of knowledge to make a specific decision, what system is in place to make sure that this knowledge a) gets to the person on time, and b) is of the correct quality?"

And like any analogy, it brings with it many other ways to think about KM. Can we apply "Lean Supply Chain" thinking to KM, for example? Can we remove waste from our Knowledge Supply Chain? Can we think of the Knowledge Manager as a supply chain manager?

Or - the subject of our blog today - can we use common Supply Chain metrics to help us understand how to metricate KM?

Here are 7 metrics from the supply chain world which might help us decide on metrics for our Knowledge Management Framework.


  • Backorders - unfulfilled orders from the customer. In KM terms, these might be search queries, or questions to a Community of Practice, which receive no answers. These are indications of the need to create knowledge resources for the user, and the number of unfilled requests is a proxy of the completeness of your knowledge base (both tacit and explicit).

  • Cycle time. There are many definitions of cycle time in the Supply Chain world, but for KM the crucial cycle time is how long it takes from the first observation of new knowledge, to that knowledge being embedded in the knowledge bases, training courses and community of practice resources. Or in lesson-learned terms it might be the time from "Lesson identified" to "Lesson closed". In CoPs it might be the "question to answer" time.


  • Defects - defective supplied material. This is a quality measure of your knowledge content, measuring how much of it is out of date, wrong, or unhelpful. You could measure the quality of lessons entering your lessons management system for example, or of articles published to a knowledge base, or of answers in a community forum.


  • Fill Rate - the amount of ordered supplies filled on the first order. In KM, this might be the number of community questions answered by the first response, or the percentage of times the answer is found in the first search.


  • Inventory costs - what it costs you to stock and manage your inventory (cost of stock, cost of warehouse, salaries of warehouse staff etc). In KM terms, this is the cost of operating your KM framework, including the cost of KM roles, the licence cost for KM software, and the time cost from populating the system. This represents the total costs to the business of operating KM.


  • Gross margin return on inventory - the  gross margin divided by the inventory costs, a popular metric for retail stores. In KM terms, the gross margin would be the overall value of KM to the business, which you would track and estimate through success cases, value stories and metrics such as decreased costs or increased sales. It is in effect the KM ROI.


  • Inventory turnover - the average annual use of your inventory; for example if a store carries 1000 items and sells 10,000 items a year, that's a 10 times inventory turnover. In KM terms this would be applied only to explicit knowledge, and you would measure the number of reads of knowledge articles divided by the number of articles.  You could of course get smarter, and you could look at which articles get the most reads and which get none at all.

Hopefully that gives you some ideas of a few more metrics you can use to make sure your Knowledge Supply Chain is working - delivering valuable knowledge to the knowledge works in your organisation in an efficient, reliable and effective way.


Friday, 4 August 2017

Expectation, metrics, rewards, support - the KM Governance quartet

Four elements make up Knowledge Management Governance. Expectations, metrics, rewards and support.


Governance is often the missing element in Knowledge Management, and although it is one of the four legs on the KM table, it is the one that gets least attention.  This is partly because governance is not easy, and partly because there is no clear published model for KM governance.

Governance represents the things that the organisation does, and the management of the organisation does, that drive the KM behaviours and adoption of the KM Framework. We see four elements to governance - expectations, metrics, rewards and support.

Knowledge Management Expectations.


The first thing management needs to do in terms of governance is to set the expectations for KM. This requires a set of clear corporate expectations for how knowledge will be managed in the organization, including accountabilities for the ownership of key knowledge areas, and the definition of corporate KM standards, KM principles and KM policies. These documents should tell everyone what is expected of them in Knowledge Management terms.

Different departments can then add to these expectations, and individuals with KM roles will have KM expectations written into their job description (see examples here).  Within a project, the expectations are set by the Knowledge Management Plan.  Expectations may also be set using the competency framework.

If there are no clear expectations, nobody will know what they should be doing in KM terms.

Knowledge Management Metrics.


If standards and expectations have been set, then the organisation needs to measure against these expectations. For example, if the corporate expectation is that every project will conduct a lesson learned session, and every knowledge topic has an owner, then you should measure whether this is happening.

There are other types of KM metric as well - see these blog posts for more discussion.

If there are no metrics, then nobody will know what people are actually doing in KM.

KM rewards and recognition.


If you are measuring people's performance against the expectations, then this needs to be linked to rewards and recognition. If people do what they are expected to, this should be reflected in their rewards. If they don't do what is expected, then there should be a sanction. See these blog posts for a wider discussion of incentives.

If there are no links between metrics and reward/recognition, then nobody will care about the metrics. Particularly important are the sanctions for not doing KM. If people can dodge their expectations and get away with it, then this sends a strong message that the expectations are actually options, and not expectations at all.

Knowledge Management support


It is unfair to set expectations, measure people against them, and then reward people based on these measures, unless you make the expectations achievable in the first place. Therefore you need to set up the systems, the training, the coaching, reference materials and so on, that make it possible for people to meet their expectations.

If there is no support, then you have set up an unfair system which people will resent.

Together, the quartet of Expectations, Metrics, Reward/recognition and Support form the basis of an effective Knowledge Management governance system.


Friday, 2 June 2017

Do your KM metrics cover seeking and using as well as sharing?

When it comes to determining Knowledge Management Metrics, make sure you cover the Demand side as well as the Supply side. 

Image from wikimedia commons
The most difficult aspect of Knowledge Management to address is re-use, and yet re-use of knowledge is the whole point of KM. All of the discussing, capturing, documenting and storing of Knowledge is in service of re-use. Therefore when we metricate KM, we need to think about metrics for Knowledge Demand and Re-use, and not just Supply.

It is easy to create metrics for Knowledge Supply, for example:

  • Number of lessons added to the Lessons Database
  • Number of blogs
  • Frequency of articles on the community blog
  • "Best blog post"
  • Number of new items in the portal
  • Frequency of edits and updates to items on the portal
  • Number of wikipages
  • Individuals who make most contributions to the knowledge base
  • "Best knowledge base article"

It's not so difficult to cover the demand side as well, through metrics such as:

  • Number of questions asked per month on the community forum
  • Time between question and first answer
  • Number of answers per question
  • Number of readers of the community blog
  • Number of reads per knowledge asset or knowledge article
  • Frequency of searches of the knowledge base
  • Search success rate
  • "Time to find" knowledge
It's a little harder to measure re-use, but it can be done through metrics like these:
  •  instances of lessons reuse
  • evidence of Community value, delivered through solutions to members’ problems, and presented as success stories
  • user feedback and satisfaction ratings
  • number of lessons which have been embedded into procedure 
  • average time taken to embed lessons

The demand metrics and re-use metrics can be very interesting. For example one of the ways the World Bank disseminates knowledge to external stakeholders is by publishing reports. It would be easy just to measure the number of reports created, but in addition they commissioned a study of "Which World Bank Reports Are Widely Read", which was able to analyse which of the reports were widely downloaded and cited, and which remained unread.  A lot of effort and knowledge goes into these reports, and the last thing the World Bank wants is to create reports which are never downloaded.

Demand-side and re-use metrics such as these are very important to the success of your KM program.

Make sure your metric system is well balanced, covering supply, demand and re-use.


Tuesday, 2 August 2016

How to map the KM culture change

Measuring the progress of Knowledge Management within an organisation is a tricky thing to do. Here's one method.


Zika virus map, from wikimediam commons
One of the issues with the KM culture change is that it is not a gradual behaviour change over time; it's a step change.

People and teams don't go from a behaviour of ignoring knowledge as part of their work, to largely ignoring it, to slightly ignoring it etc - they go from ignoring knowledge, to treating knowledge as being of value. It's a binary switch.

If a team *really believes* in the operational value of knowledge, they will find their own way to work with it, using paper and pen and phone conversations if necessary. And if a team *really does not believe* in the operational value of knowledge, then the best toolkit in the world will not help them.  You can't half-do KM.

This culture change is not a gradual change, it's a step change. It requires a different set of priorities, and a different way of working. It's more of a revolution than an evolution (see my post on trees and butterflies).  It's more like a virus sweeping through a population - you have either caught the KM virus, or you haven't.

In a previous post, I presented 8 steps to attitude change, which lists the 8 steps any one individual will go through in their head and heart as you introduce KM. However there is only one step that leads to behaviour change, and that is the step of Trial; the point at which the individual tries KM.

Therefore you only know that the KM culture change is working, because there are some groups where the change has taken place. It's not that the whole culture is gradually changing, it's that you can point to examples who have bridged the culture gap, who have passed the Trial step, and who are thoroughly infected with the KM bug.

Measure the KM culture change in the same way that an epidemiologist measures the spread of a virus. Map out the progression of KM across your organisation, like you measure the spread of infection across the world (see the Zika virus map above).

The difference of course is that the epidemiologists and doctors are trying to control Zika, whereas you are trying to infect the organisation deliberately with KM - but the method of mapping progress is the same.

Draw a map. Make it visual. Show how KM is being adopted team by team and department by department. Show KM behaviours, indicated  the adoption of a Knowledge Management Framework,  moving across the organisation until the whole map turns green.

Thursday, 21 April 2016

Measuring stock and flow of knowledge

The Intellectual Capital movement attempts to measure, or account, for the Stock of Knowledge in an organisation. Its actually easier to measure knowledge flow.

Rate of Flow

What should we measure in Knowledge Management? The amount of knowledge, or the flow of knowledge?

There is no absolute scale for measuring the amount of knowledge held by a person, or held by an organisation.  There is no "milliknow, centiknow, kiloknow, megaknow" metric scale for know-how. No scales, no tape measure.

This makes it really hard to measure the stock of knowledge. You can measure the number of experts and roughly grade their expertise, and you can measure the contents of a knowledge base, but of course quality can trump quantity (As Prusak and Davenport said - Volume is the friend of Information and Data management, and the enemy of Knowledge Management).

Then you can also measure intellectual capital as being the difference between asset value and stock price, which is partly influenced by Knowledge, but also by relationship capital, brand capital and so on.

What you can measure, is a change in knowledge - "Yes, I know more now than I did before this meeting, or this conversation".

You can also measure the effect of this knowledge - "Now that I know more, I can perform this task faster, or more cheaply, or to a better quality".

It is therefore far easier to measure the FLOW of knowledge, than it is to measure the STOCK, and then through Flow, to measure VALUE.


Activity Metrics such as the ones below are more useful than volume metrics.

  • number of lessons learned activities in projects 
  • lessons added to the lessons management system
  • instances of lessons reuse
  • number of lessons embedded into procedure vs number waiting to be embedded
  • time taken to close lessons 
  • number of community activities and levels of participation in those activities; 
  • number of questions asked per month; 
  • number of answers per question
  • time between question and first answer
  • number of readers of the community blog
  • frequency of articles on the community blog
  • user feedback and satisfaction ratings, collected through a user rating system
  • number of reads per knowledge asset or knowledge item
  • number of comments
  • frequency of edits and update
  • number of new items 
  • re-use rate of knowledge assets
  • frequency of searches of the knowledge base
  • search success rate
Even better are the Outcome Measures:

  • evidence of value added through km activities in projects, and presented as success stories 
  • evidence of community value, delivered through solutions to members’ problems, and presented as success stories 
  • evidence of value through use of knowledge base, gathered through user feedback, and presented as success stories
  • evidence of value delivered through the lessons learned process, presented as success stories
Don't try to measure the volume of the stock of knowledge - measure its flow and its impact instead.

Wednesday, 15 July 2015

COLK - the Cost of Lost Knowledge

One the  enduring challenges in Knowledge Management is defining effective metrics to measure its value. A promising metric which may fill the gap is the Lost Knowledge Frequency (LKF) and it's partner the Cost of Lost Knowledge. 

Image from wikimedia commons

In safety management, they talk about "lost time incidents" (LTI), where through the failure of the safety management system, somebody sustains an injury which causes them to lose time at work, either through treatment or through convalescence. A core safety metric is the LTIFR, or Lost Time Incident Frequency Rate.

In knowledge management, we could talk about "lost knowledge incidents" (LKIs). This is where the knowledge is or was once available to the organisation, but failed to reach the person who needed to act upon it.

 Unfortunately a lost knowledge incident is far less visible than a lost time incident. An LTI is visible because a person is not available for work, while a LKI is only visible when a mistake is repeated or a capability lost. Probably the majority of LKIs go undetected.

However you can measure this frequency through surveys or through careful analysis of the lesson learned system. A company I was working with recently ran a survey in 2005 where one of the questions asked was "do you know of any examples where projects failed because lessons were ignored or missed". 75% of staff answered yes. In a more recent survey, this had fallen to 26% - still too high, but a massive improvement.

The Lost Knowledge frequency is one parameter, the other is the cost of the lost knowledge (COLK). In some cases this can be huge.  Here is a very good example, where the loss of knowledge about making nuclear weapons cost £69 million to replace.   If you can look at a selection of lost knowledge episodes and calculate the cost of these to give an average cost, then multiply this average cost by the estimated Lost Knowledge Incident Frequency Rate, then you end up with a total estimated COLK.


So how does an LKI happen?

  • It can happen when somebody has knowledge, but doesn't want to pass it on or record it. This is a cultural failure.
  • It can happen when somebody has knowledge, but has no mechanism to pass it on or record it. This is a failure of the KM framework (and by Knowledge Management framework, I mean the combination of people, process, technology and governance).
  • It can happen when somebody has knowledge and has passed it on, but that knowledge cannot be found. This is also a failure of the framework.
  • It can happen when somebody needs knowledge, and has the mechanism to find it, but doesn't know that they should look. This I would suggest is also a failure of the framework, because there should be processes for knowledge seeking built into activity.
  • It can happen when somebody needs knowledge, and has the mechanism to find it, but they don't want to look for it or don't want to consider it. This is a cultural failure, often known as "not invented here".

What if somebody needs knowledge, has the mechanism to find it, looks for it, finds it, considers it, and then decides after mature consideration that it's not applicable for their situation? I would say that this is not a failure of the knowledge management system, and there must be many many cases when this is the right thing to do. The key here is the mature consideration - not just ignoring the lesson because you naively think "this time its different" is not mature consideration, its another cultural failure. 

Tracking LKIs and estimating their value will not be an easy task.  The survey approach described above is one way to do it ( a top-down analysis), while an analysis of project failures, cross-referenced to the lessons management system is another, bottom up, approach.

Both ways may give you a useful metric for the cost of lost knowledge, which should decrease over time as your KM system develops.

Wednesday, 6 May 2015

What happened to a community when facilitation stopped

Here is a cautionary tale about the importance of Community of Practice facilitation, and what happens when the facilitator is removed.


The story comes from Tom Humbarger, who was the community facilitator for a professional community from January 2007 until he was made redundant in July 2008.

During Tom's active role the community grew from zero to 4,000 members but as the picture above (of the number of weekly visits to the community site) shows, things changed once he was no longer playing the facilitator role. Once he was no longer in place


  • Membership growth dropped by more than 63% on a week to week basis. 
  • The number of visits to the community forum dropped by 60% 
  • The number of pages viewed per visit dropped by 22% 
  • The time on site decreased by 33%

The community of practice limped on for a few more months, but performance was lacklustre.

Tom's story, and the graph above. demonstrate clearly the value that a facilitator brings to a community of practice

Monday, 15 December 2014

Suitable KPIs for your KM team

How do you measure the performance of a Knowledge Management team? What sort of KPIs would you assign to them?

The answer to this question depends on the stage that KM implementation has reached. I suggest some KPIs below, depending on the different stages your implementation has reached.

During the strategy phase

KPIs are difficult during the strategy phase, as the KM team have not yet delivered anything - they are still planning. At this stage there is probably only one objective; "Deliver a well-researched Knowledge Management strategy and implementation plan that has the support of the key business stakeholders". This will be easier to accomplish if your key business stakeholders are acting as a steering team for the KM program. The KPI will be the level of support for the strategy.

During the piloting phase

 Part of the purpose of the Knowledge Management pilots is to deliver tangible business value through operation of KM within the pilot areas, with a secondary purpose of refining the Knowledge Management Framework prior to roll-out. The primary objective during the piloting stage is therefore the amount of value delivered.

This was the primary KPI for the BP KM team during piloting in 1998, when we were charged with delivering $100m of value to the organisation through KM pilots.  The secondary KPI for the KM team at this stage should be the number of elements of the Knowledge Management Framework which have been tested in action within the business, with improvements made as required. The target should be 100%.

During KM roll-out and transformation

During the roll-out phase, purpose of the KM team is to spread the KM transformation across the entire organisation, while continuing to add business value. The team therefore has three primary KPIs,

  • The percentage of the organisation which has reached a defined KM level, 
  • Activity metrics such as number and value of lessons, maturity of CoPs, and
  • The value added by KM to the business.
You can also add activity metrics such as the number of training courses run, the number of communities launched and so on.

During KM operation

After the roll-out and transformation phase, Knowledge Management becomes part of normal business, defined by a set of expectations within a Knowledge Management policy. At this stage, the role of the KM team is to support the business in compliance with the policy, and hence deliver value to the business.  Suitable KPIs for the KM team would be the following;
  • The level of business compliance with the expectations in the KM policy
  • Support activity metrics (such as training courses run, KM roles 
  • Addition activity metrics such as number and value of lessons, percentage of embedded lessons, completeness currency of knowledge bases,  maturity of CoPs, etc
  • The value added by KM to the business

Wednesday, 19 November 2014

4 ways to increase your "KM clock speed"

According to Erick Thompson, assistant VP for knowledge exchange, the St Paul companies, "KM initiatives should also focus on the speed factor. Companies have to learn how to learn faster". 


The world is increasingly a competitive learning field. In the past, when progress was slower and the rate of change was lower, an organisation could compete on its products, its patents, its reputation and on its people. However the rate of change is increasing, and companies need to adapt.

Markets are changing, customers are changing, expectations are changing, regulations are changing, the world is changing, and it is changing faster and faster. If companies are to adapt, they need to unlearn old habits and learn new ones. And in a competitive world, the fastest learner wins.

The British Army takes a similar view: you have to try to get inside the enemy's OODA (observe, orientate, decide, act) loop. If you generate faster tempo (rate of learning relative to that of the enemy), you will win.

So how do you hack the clock speed on your internal Knowledge Management cycle? Here are 4 steps.

1. Set targets
How long should it take to be able to find basic knowledge on your Intranet? How long should it take to receive an answer from a CoP? How long should it take before a new lesson is embedded into business process? Set some aggressive targets, like the senior manager at McKinsey who declared that all CoP questions should find an answer within a day.

2. You build the knowledge bases that cover routine activity
Any knowledge that is sufficiently mature, simple, and context-independent should be documented online in an easily findable location. All of your process documentation, manuals, training material should be put onto a wiki or similar knowledge base.

3. You build your Communities of Practice
Any knowledge that is less mature, more complex or more context-dependent may not be documented. Ensure you create the networks of people through which this knowledge can be transferred. Focus the CoP on problem solving and on answering questions if you want it to perform rapidly. Focus on Pull, not Push. 

4. You increase your lesson-learning speed through active lessons management
This blog post describes two lessons learned systems - one which takes 2 years to make changes based on new lessons, and one which takes a couple of weeks. You cannot afford to wait years for lessons to be embedded. Each unembedded lesson is a lesson currently unlearned, and an unlearned lesson carries the risk of reinvented wheels and repeat mistakes. Ensure you have an effective Lessons Management system, with a person or team in charge of making sure it is working well and quickly.

And here's a 5th way, for good measure


5. Measure against the targets you set.
Collect, and report, "speed of learning" metrics. Your dashboard should include online search time, the time to reply to CoP questions, and the time it takes to a) document and b) embed lessons. These are measures of your learning clock-speed. Seek to keep these times as low as possible, and continuously decreasing.


Monday, 27 October 2014


KM Change model vs KM Maturity model


Earlier this week I took part in a telephone discussion about Knowledge Management maturity models, set up by Stan Garfield.  I know Stan asked me to take part because of my contrarian views (such as my post on why KM Maturity models can be dangerous), as he was looking for some debate on the topic. 


Here is the basis behind my thinking.

The use of a maturity model allows an organization to have its methods and processes assessed according to management best practice, against a clear set of external benchmarks. Maturity is indicated by the award of a particular "Maturity Level". The majority of KM maturity models (and ours is no exception) have a series of descriptors of various levels of KM maturity, and the implication is than an organisation can progress from one level to the next in a smooth maturation process.

The analogy, if you like, is that of a tree. As a tree matures, it passes from a seedling to a sapling to a mature tree, but this is a continuous progression. You can describe, using metrics such as the number of branches, size of trunk, number of fruit, where the tree is on its maturation journey. If you won an orchard, you can describe the average maturation level of the trees as (for example) 2.5 on the maturation scale.

Knowledge Management is more like a Butterfly than a tree.


A butterfly does not mature slowly, it goes through discrete changes. It goes through three main stages - several months (sometimes years) as a caterpillar, a few days or weeks as a pupa (unless it overwinters) then emerges as a butterfly. You would be better off describing a butterfly with a change model than with a maturation model. If you own a butterfly farm, you measure the maturity of butterflies not on a maturity scale, but on a percentage change basis. You say "none of them are butterflies", "20% have hatched as butterflies" and so on.

Knowledge Management is a butterfly rather than a tree, because implementing KM is a culture change process. It involves changing hearts and minds, and hearts and minds, like butterflies, are changed one at a time. We have all seen the moment when a heart/mind changes and someone "gets lit". It's that lightbulb moment, like "catching fire". (There's another metaphor for KM in an organisation - a bonfire. Either it's caught fire, or it hasn't. Once it has, the question becomes "how much is burning").

I describe here a change model for hearts and minds which you can apply to your key stakeholders, that takes them up to a commitment threshold, beyond which KM can be adopted. Below this threshold they are KM caterpillars; afterwards they are KM butterflies.

KM then works only if all the conditions are sufficiently right to change the hearts and minds.

What's the problem with maturity models?


I see two problems. The first is the idea that progression up the levels equals progress.

Take Leadership, for example.

Senior management support is the biggest enabler (and lack of senior management support is the biggest barrier) to KM. Leadership is vital. Imagine a leadership scale from 0 to 4, like the maturity model Stan Garfield shows. Imagine you have moved leadership from level 1 to level 2. Is this progress?

If level 4 is "whole--hearted support from senior management", what is level 2? Half-hearted support? That's as bad as no support at all. Until you get to level 4, you don't have what you need for sustained KM.

Rather then trying to move the whole organisation to level 2, why not find the one leader who you can help reach level 4? Leave  the rest at level 1 for the moment, and find the early adopter. Gain his whole-hearted support to pilot Knowledge Management in his part of the business, deliver success, and use this to change the next Heart and the next Mind.

Secondly there is the idea that different enablers can "mature" at different rates. This ignores the fact that Knowledge Management is a system, with all parts working together. For another analogy, think of KM as a central heating system. Here you need many elements to make the system work - boiler, radiators, pipes, pump, thermostats, fuel supply, electricity supply - in order to move heat through your house. Similarly you need many elements to move knowledge through your organisation.

Better to build a small complete system somewhere as a prototype or proof of concept, than try and perfect individual elements everywhere.

What is the alternative?


In Knoco, we actually do offer a maturity model, which we give away for free, or provide as an online survey. It is of some use, but treat it with caution for all the reasons mentioned above.

Instead we suggest you measure a number of other things

The real message behind all of this is that KM is a change program, and needs to be measured using change models.

It does not mature like a tree; it changes like a butterfly and catches hold like a flame, and that is how it should be measured.


Friday, 16 May 2014


Can you do KM where you can't measure performance?


If you are in a line of work where you can't measure performance, then you are going to find it difficult to introduce effective Knowledge Management.

Knowledge Management is a systematic approach to organisational learning; but learning about what? Learning to perform, is the answer. Learning to perform means the identification of better ways to do things, and then sharing and replicating those better ways, and embedding them into the processes and structures of the organisation. We can measure the result of this learning in learning curves.

But "identifying the better ways" requires metrics, and effective performance metrics can be challenging to find.

Let's take the case of a national health service as an example.

We know that metrics has been a very difficult topic in nationalised health services - that many metrics that have historically been applied by government were at best arbitrary and that some may have led to gaming-style behaviours. As a result there has been a suspicion of metrics.

A friend of mine was involved in an attempt to set up a community of practice for hospital head nurses. They had a few meetings, exchanged interesting stories about how they did things in their own hospital, and then went back home and carried on doing things they way they always had.

What was the incentive for them to change their ways of working?  Why would they go through all the upheaval of change, unless they were convinced that there was a better way of doing things? Those other stories were interesting, but "we do things differently here".

That's where metrics come in. They help prove that there is a better way to do things that you never thought of, and give you the incentive to learn. And they tell you who to learn from as well.

Imagine that the head nurses, instead of sharing stories, had chosen one or two key metrics. Infection prevention, for example. Pain management. Medication administration. Imagine they had compared numbers, and found the best performers. Imagine they had all committed to improving their own metric, through learning from the others.

That's where knowledge management takes over - in facilitating that learning, knowledge sharing, and knowledge re-use.

Then imagine them applying the knowledge, and seeing the metrics improve. That, for them, would be a proof of concept for knowledge management.

If you find yourself in a context where metrics are not easy, then find something - something at all - that you can measure that is important, and apply knowledge management to that. You will find that the most effective place to start.

Tuesday, 15 October 2013


Knowledge Management at Alaskan drill-sites


Drill Rig This paper here is an interesting (if somewhat technical) look at knowledge management in a remote and difficult business - drilling oil wells in the Alaskan Wilderness.

In the drilling business, time is money, and knowledge management is routinely applied to improve drilling performance through finding more efficient ways to operate, and through learning to eliminate wasted time.

The Alaskan drill crews use a Knowledge Management framework to help improve drilling performance, including the following elements;

  • Clear management expectations and support
  • A Technical Limits workshop, to drive "Learning Before"
  • A Technical Limits coach, with accountability for driving the learning and improvement process on the rig site
  • Rigsite meetings to identify and discuss lessons learned
  • A supporting lessons management system
  • Collection of metrics on key performance indicators such as the lessons closed/pending ration.
This metric is described as follows;
"Another important aspect is the gathering and processing of lessons. Closure of a lesson is generally defined as validation that a document, procedure, or rig-specific item has been changed. The Lessons Learned database maintains a good closed/pending ratio indicating a high level of activity and involvement moving lessons learned into rig operations."
The  pie chart to the right is a typical example of this metric, showing how 82%of the lessons identified at the rigsite have been "Closed" or "Completed" through embedding the learning into procedures.

The outcome, for the drilling teams, is continuously improved performance.

This is illustrated in the line-chart to the right, showing how the time for certain operations has been improved over a series of wells, through applying the learning framework described above.

The time to test the BOPE, for example, has been reduced from 17 to an average of 5 hours, and the time taken to mill a window has been reduced from 15 to 10 hours.

In a remote hostile environment, where time is money, a simple knowledge management framework is delivering step-out improvements in performance.

Blog Archive